Research / Deep Learning · Finance
Published / 2023
GRU–VIX Exchange Rate Model
Can market uncertainty improve a currency forecast?
Combining a GRU sequence model with VIX information to connect exchange-rate patterns with a broader market signal.
- Model
- GRU + VIX
- Coverage
- Three currency pairs
- Online publication
- October 2023
01
The question
The study examines USD–CNY, EUR–USD, and GBP–USD, bringing fundamental information and technical analysis into a single forecasting approach.
02
The comparisons
The reported comparisons replace VIX with China CSI300 stock index futures, replace GRU with LSTM, and introduce data preprocessing to explore alternative model configurations.
03
Reading the model comparisons
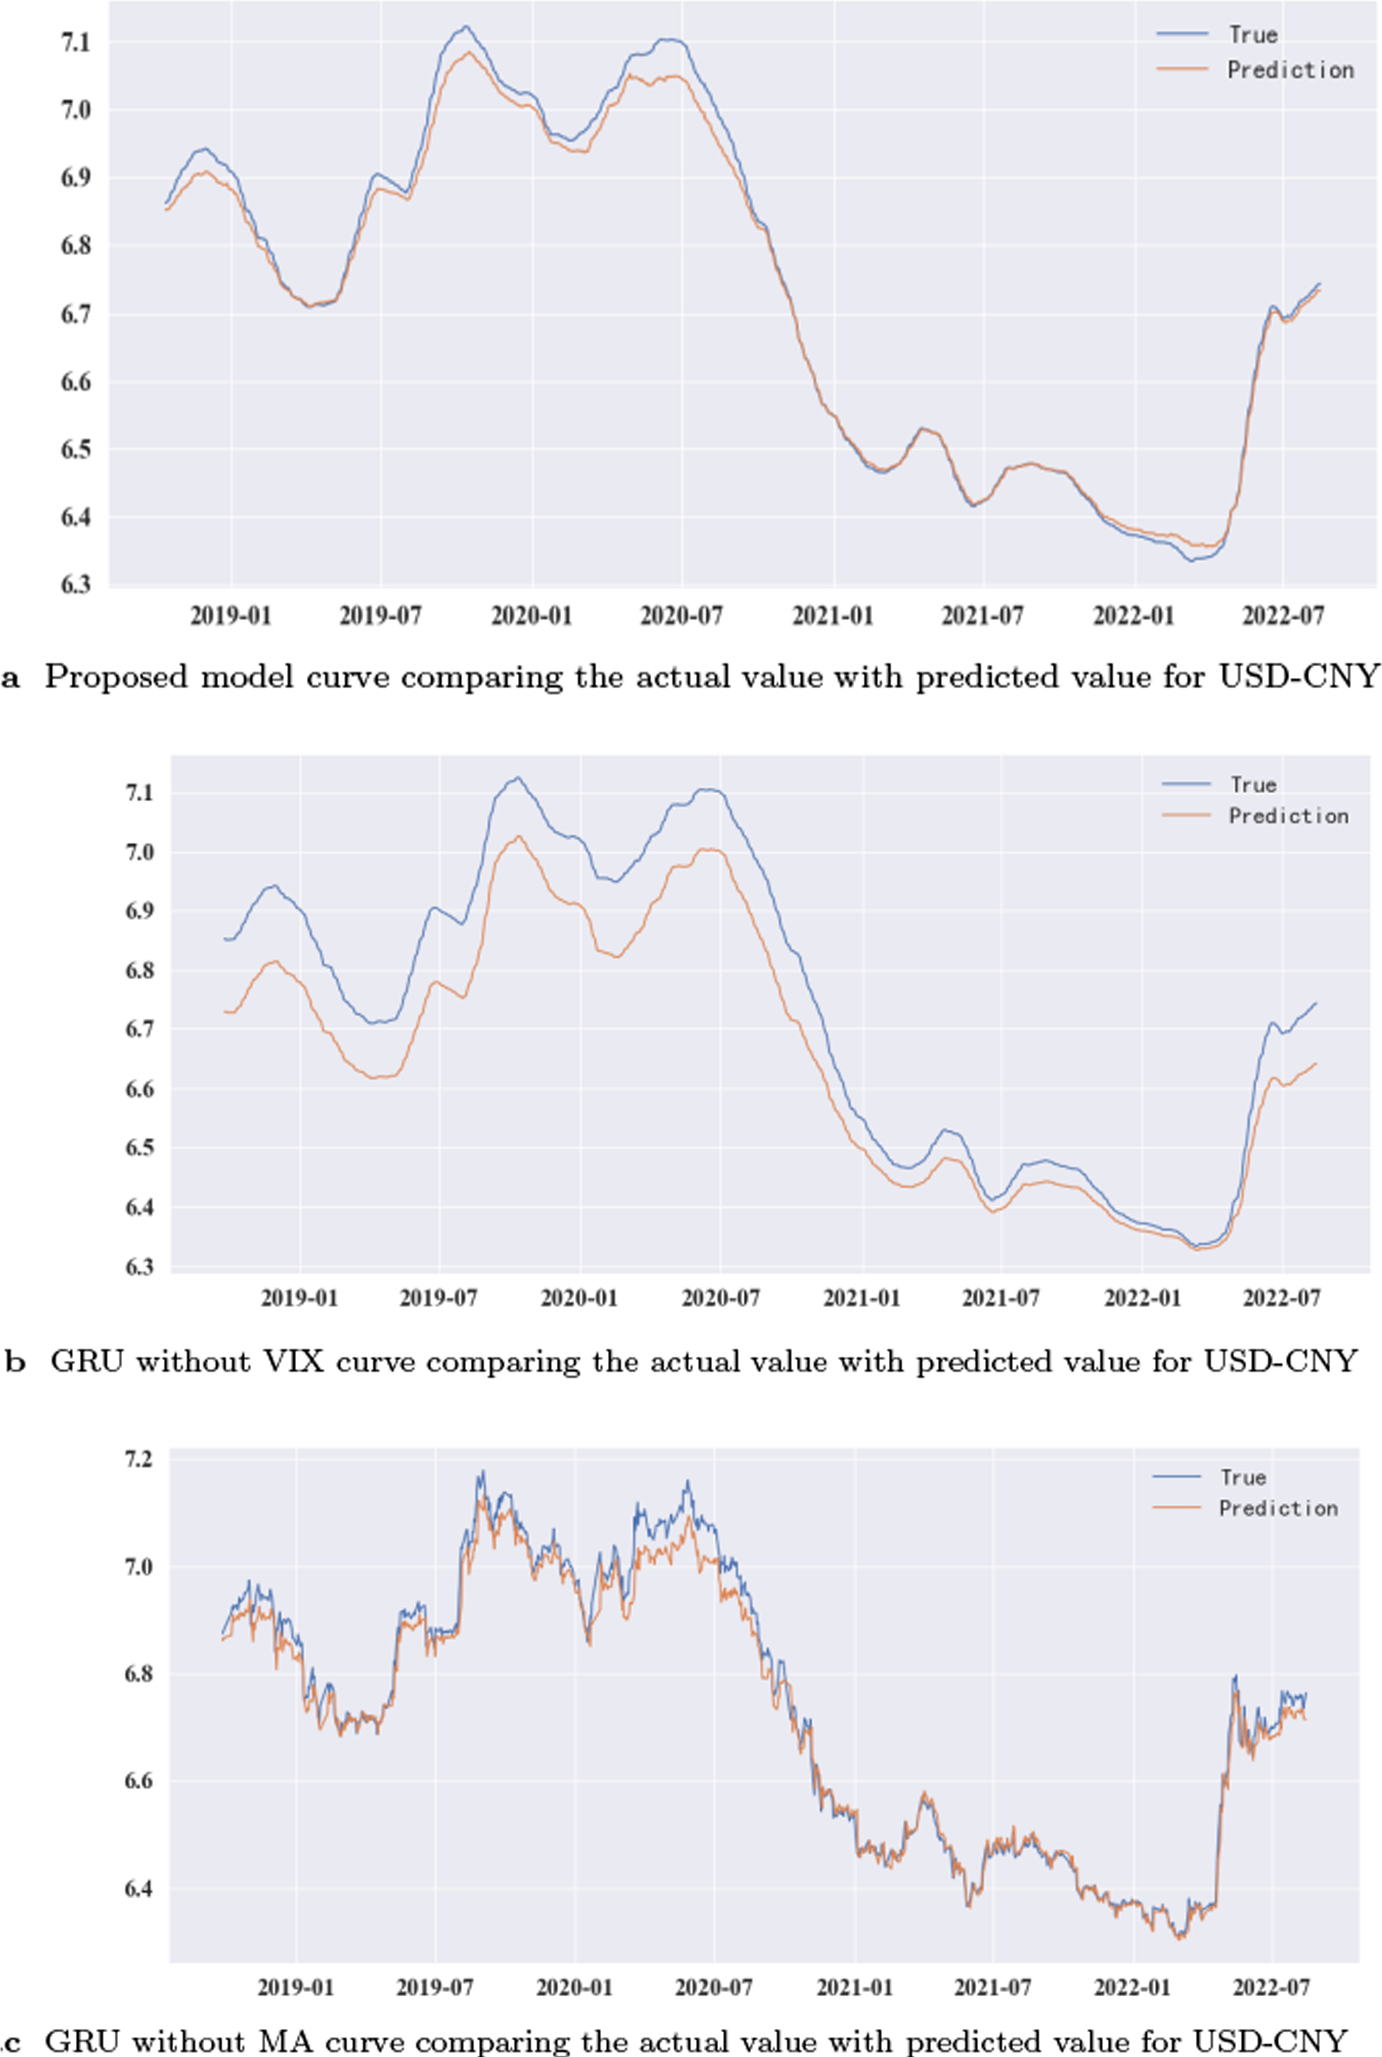
Figure 4 separates the proposed model from versions without VIX or MA, a simple GRU, and an LSTM model. The first three panels are reproduced below. Removing one input or processing step helps isolate its contribution instead of comparing only unrelated models.
04
Prediction curves and residual differences
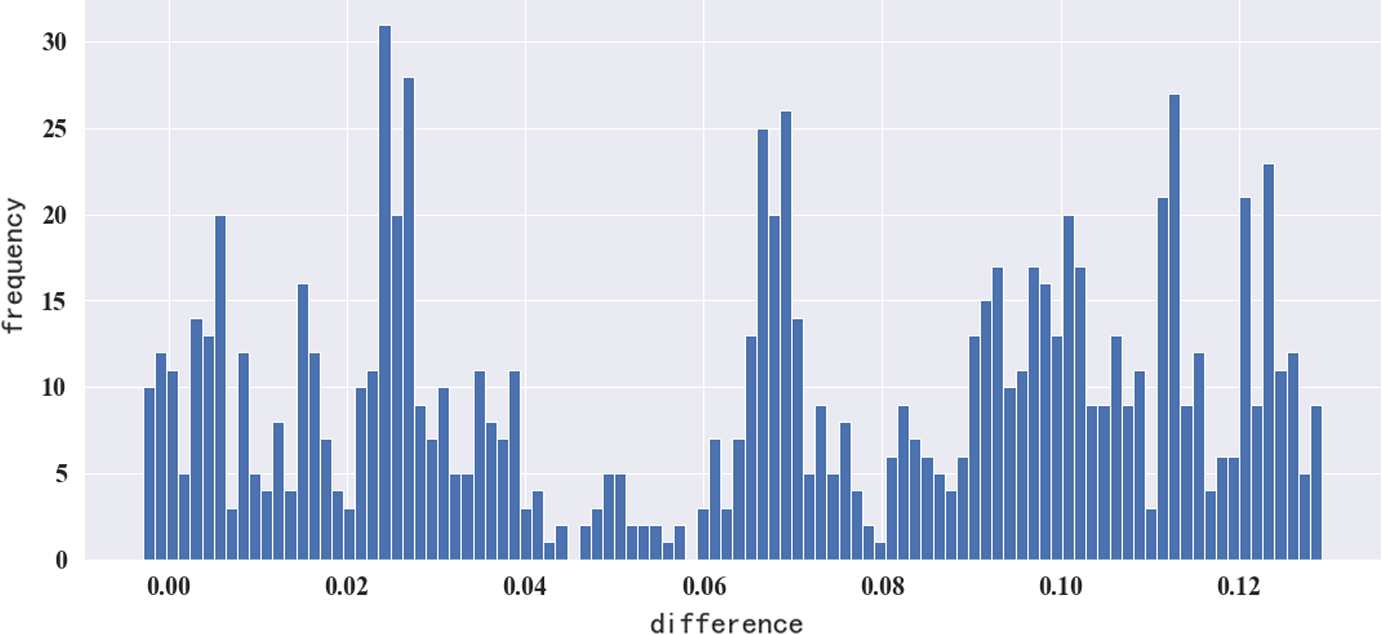
The USD–CNY panels show observed and predicted values over a timeline spanning 2019–2022. They reveal differences in tracking peaks and troughs. Figure 7 adds a distribution of prediction differences; a close-looking curve alone does not describe the full error pattern.
05
The finding
The published abstract reports better accuracy and stability for the proposed approach than the compared alternatives. The overview uses the abstract and original figure panels; consult the full paper for numerical metrics and experimental settings.
Evidence / Original paper figures
Inside the experiments
The paper / Collaborative research
Exchange Rate Forecasting Based on Integration of Gated Recurrent Unit (GRU) and CBOE Volatility Index (VIX)
Hao Xu, Cheng Xu, Yanqi Sun, Jin Peng, Wenqizi Tian, Yan He (2023)
Computational Economics (SSCI)
First published online in 2023; included in Volume 64 (2024).